I am capturing stellar spectra using a 200 mm Meade LX-90 telescope with 0.63 Focal Reducer (Effective Focal Ratio f/6.3), QHY5 mono camera, and a Star Analyser SA100 grating. The camera is mounted on a “flip mirror” diagonal, which allows the telescope to be aligned visually with an eyepiece, and then the mirror is flipped out of the light path to the camera and grating.

The following image is a stacked composite of 8 x 60-second frames captured on the evening of 25 August 2016 from my light-polluted backyard in suburban Brisbane (Australia). Neptune had an apparent visual magnitude of 7.8 at the time. (The exposure is reasonable, but for an improved quality spectrum for analysis, a longer capture session with a greater number of stacked frames would have helped.)
Neptune is at centre-left, with its spectrum spread across the centre of frame, and there are three other unidentified “field stars” visible in the frame. (Could the dim star just below and left of Neptune be Triton?)

There are some conspicuous dark absorption bands in the spectrum of Neptune - let’s see if we can work out what we’re looking at.
The spectrum image was loaded into the RSpec spectral analysis program, which reads the intensity of the image and produces a graph of intensity vs wavelength. (Note that even though the spectrum is captured in B&W, the software can synthesise the visible colours.)
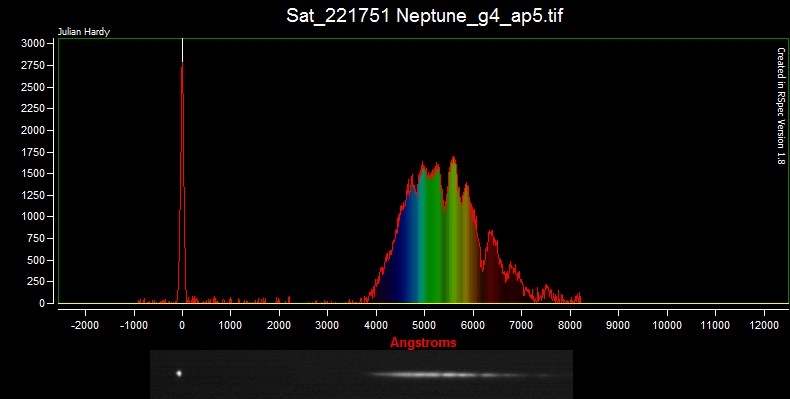

Note the “bell curve” shape of the spectrum plot - this is largely due to the varying sensitivity of the camera for different wavelengths. The camera is designed to capture visible light, with peak sensitivity in the green, diminishing sensitivity in the blue and red, very limited sensitivity in the Ultraviolet (< 4000 Å), and limited sensitivity in the Infrared (> 7500 Å).
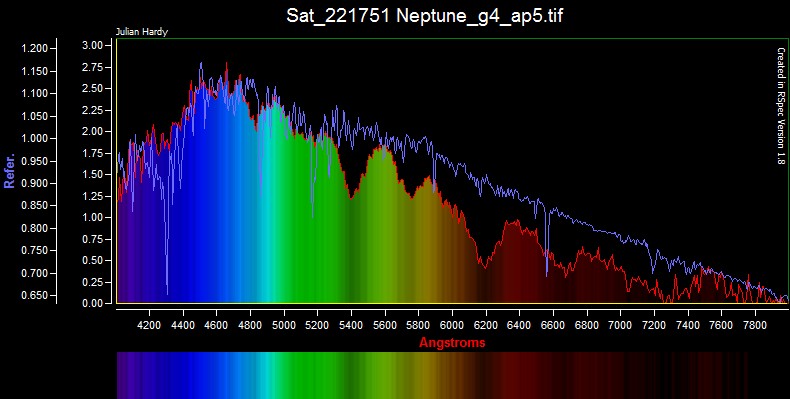
When we calibrate for the Instrument Response, we get the following graph, which better represents the ACTUAL relative intensity of the spectrum across the range of visible wavelengths.

Neptune shines in reflected sunlight - and the Sun is a Class G2V star. When we overlay a classic G2V spectrum, we can see that the spectrum of Neptune broadly follows the same shape, but there are some conspicuous absorption bands which are not seen in the Sun’s spectrum - what could these be?
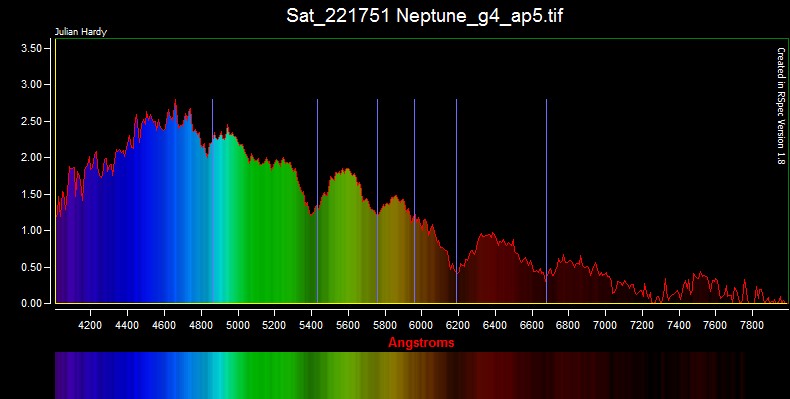
Methane is commonly known for its absorption in the infrared (hence its significance as a Greenhouse Gas in the Earth’s atmosphere), but it also has a number of absorption / emission lines in the visible spectrum, at wavelengths of 4860, 5430, 5760, 5960, 6190 & 6680 Å.
When we overlay these lines on the spectrum, we see an excellent correlation. Bingo! Neptune’s atmosphere is confirmed to contain a significant amount of Methane!
This may not come as any news to experienced planetary scientists (I don't think NASA needs to launch a mission to confirm my “findings”!), but I find it quite astonishing what can be accomplished by a very inexpert amateur with very modest equipment in their backyard!
No comments:
Post a Comment